TF-IDF と BM25 のスコア比較
3 min
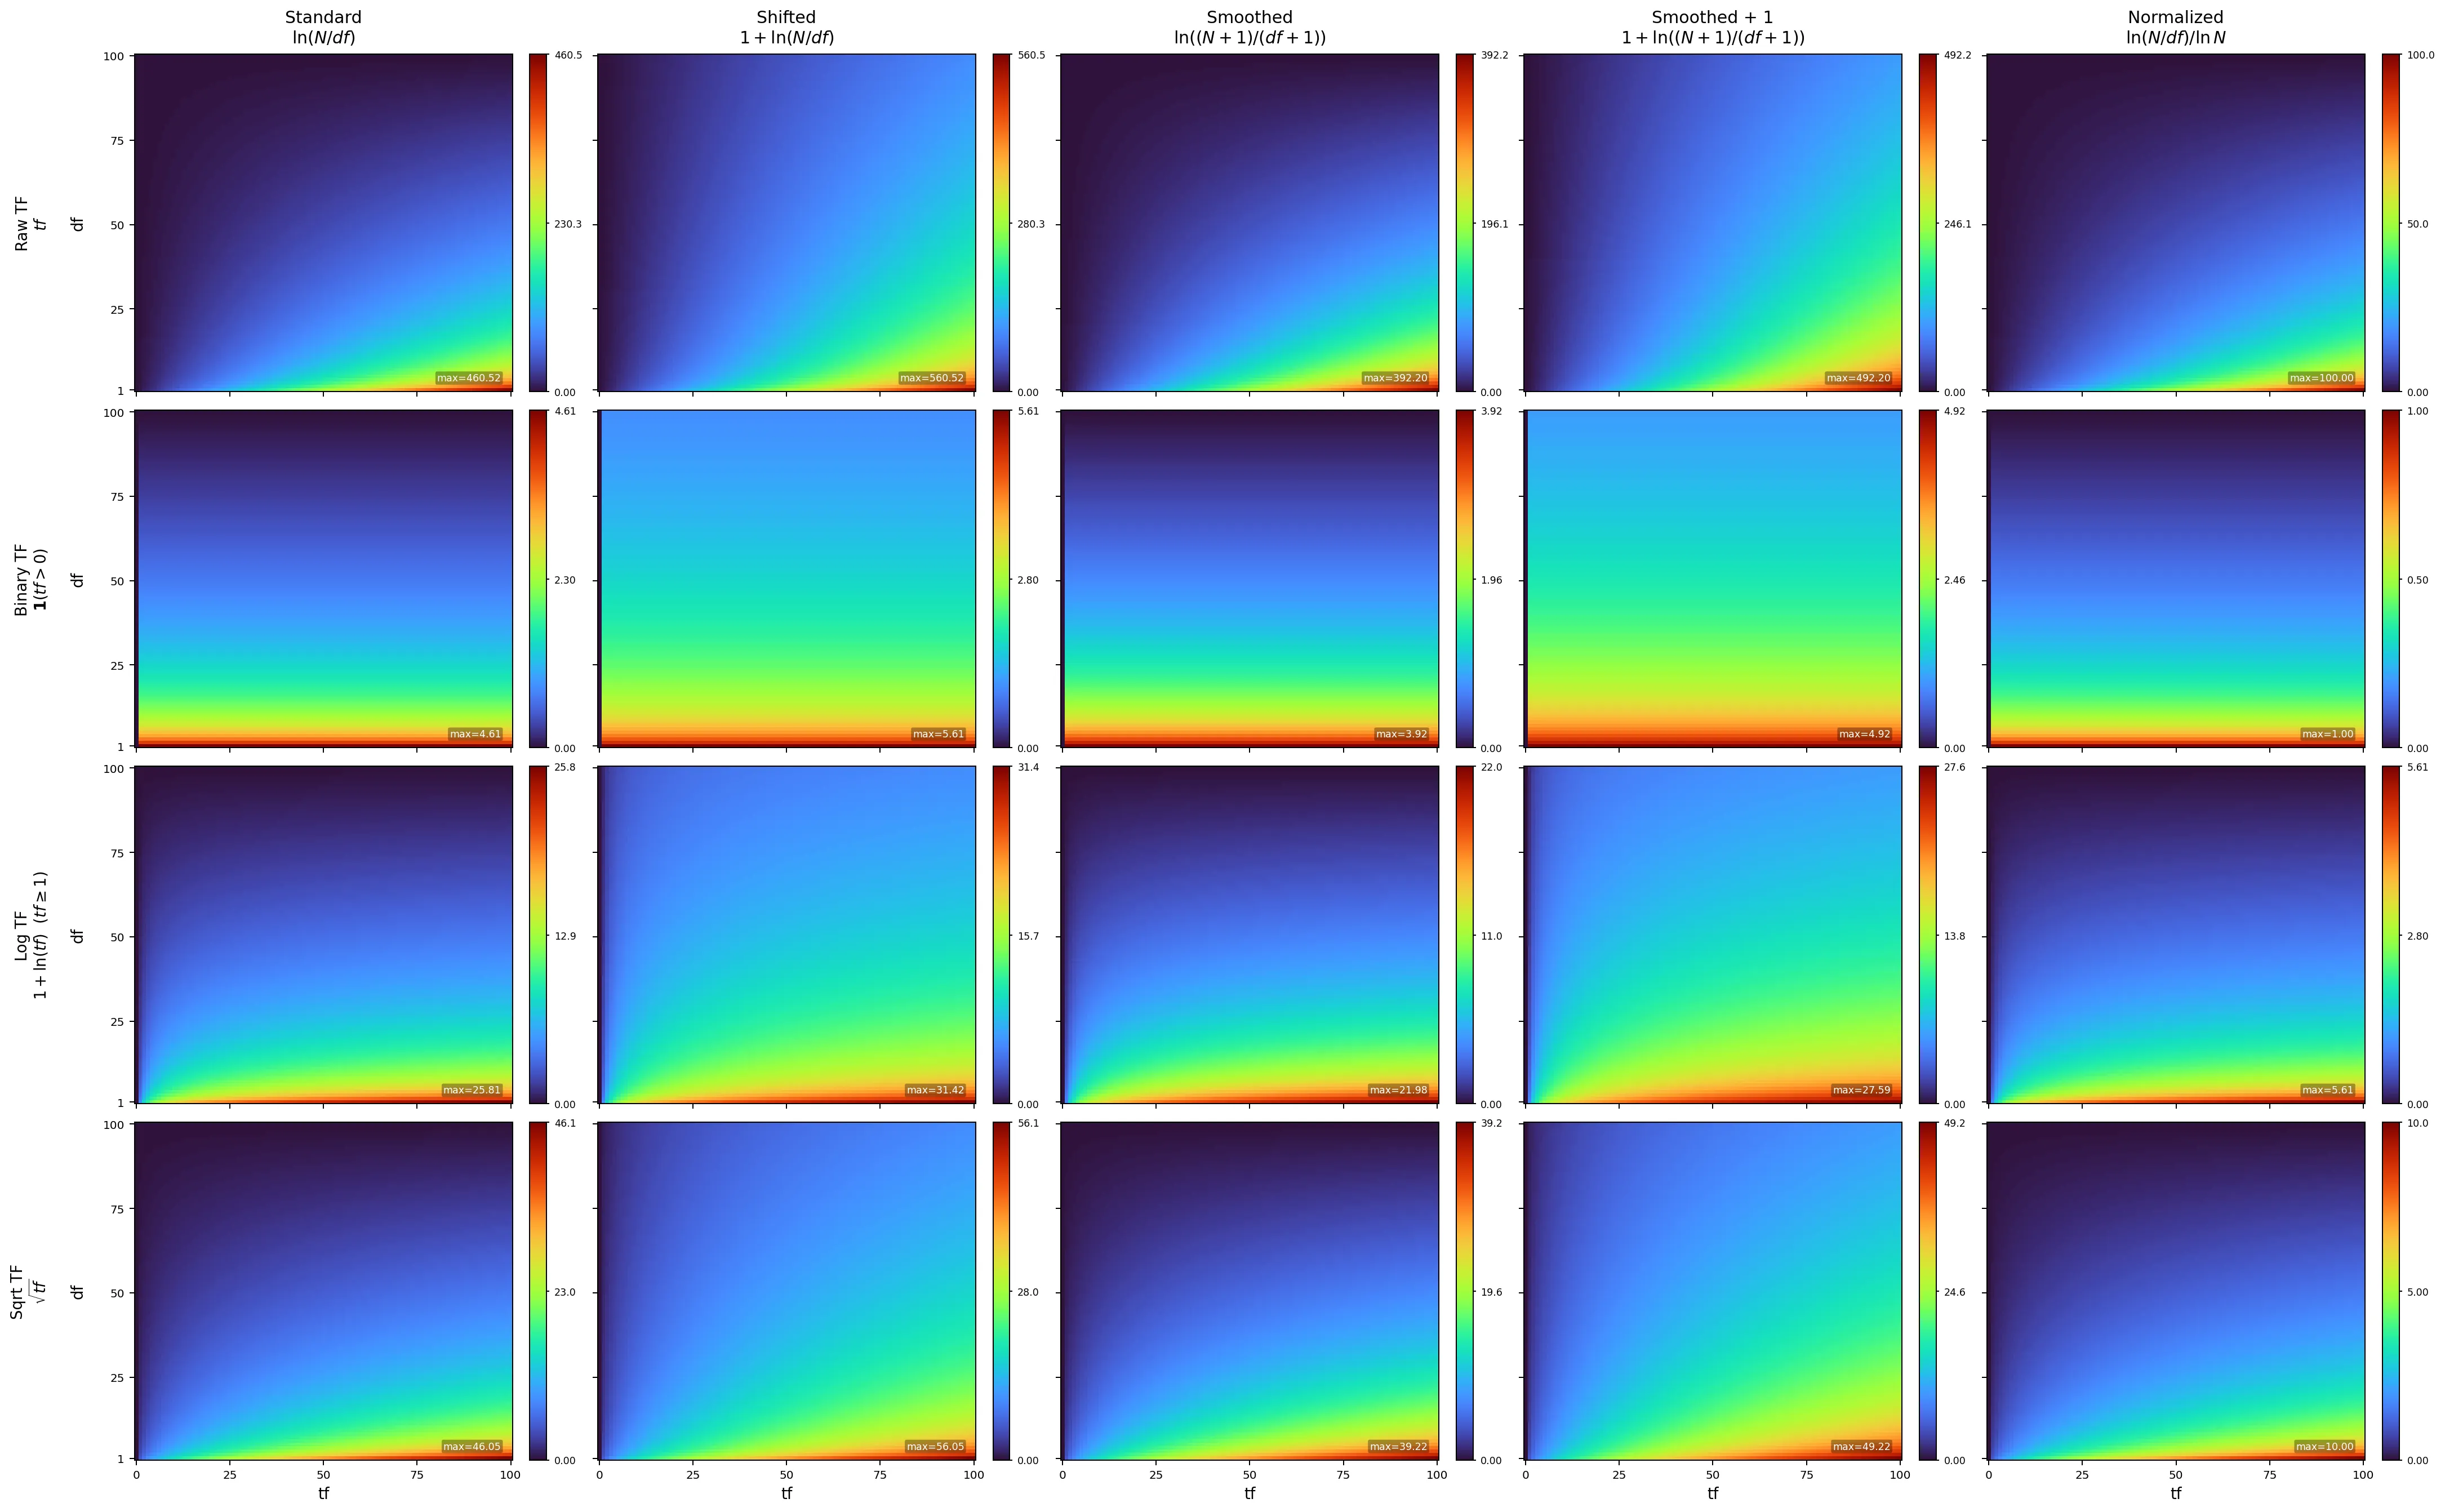
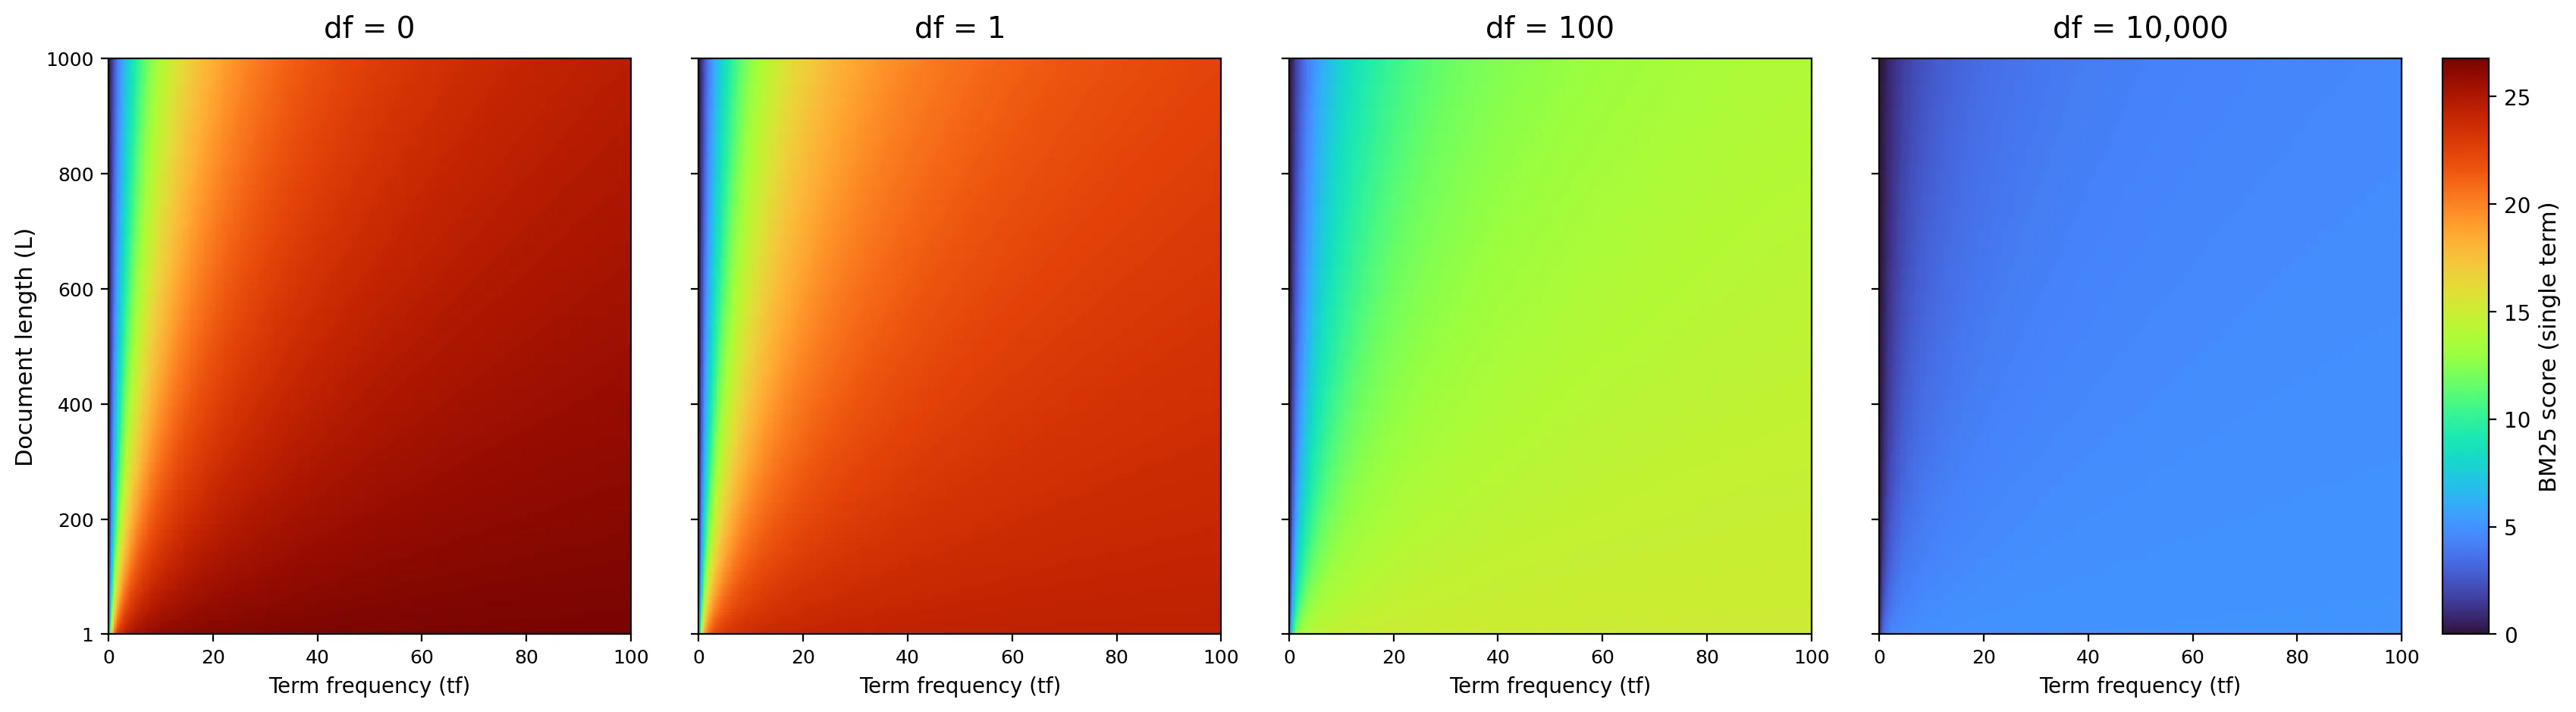
スコアヒートマップ
TF-IDF
文書数Nは100。
BM25
TF-IDF のコード
import numpy as np
import matplotlib.pyplot as plt
from matplotlib.colors import Normalize

# -----------------------------
# Shared conditions
# -----------------------------
N = 100
tf = np.arange(0, 101, dtype=float)   # tf = 0..100
df = np.arange(1, 101, dtype=float)   # df = 1..100

# -----------------------------
# TF variations (rows)
# -----------------------------
log_tf = np.zeros_like(tf)
log_tf[tf > 0] = 1 + np.log(tf[tf > 0])

tf_variants = [
    ("Raw TF", "tf", tf),
    ("Binary TF", "1(tf>0)", (tf > 0).astype(float)),
    ("Log TF", "0 if tf=0; 1+ln(tf) if tf>=1", log_tf),
    ("Sqrt TF", "sqrt(tf)", np.sqrt(tf)),
]

# -----------------------------
# IDF variations (columns)
# Probabilistic IDF excluded
# -----------------------------
idf_variants = [
    ("Standard", "ln(N/df)", np.log(N / df)),
    ("Shifted", "1 + ln(N/df)", 1 + np.log(N / df)),
    ("Smoothed", "ln((N+1)/(df+1))", np.log((N + 1) / (df + 1))),
    ("Smoothed + 1", "1 + ln((N+1)/(df+1))", 1 + np.log((N + 1) / (df + 1))),
    ("Normalized", "ln(N/df) / ln(N)", np.log(N / df) / np.log(N)),
]

# -----------------------------
# Figure and axes
# -----------------------------
rows = len(tf_variants)
cols = len(idf_variants)

fig, axes = plt.subplots(
    rows, cols,
    figsize=(22, 14),
    dpi=170,
    sharex=True,
    sharey=True
)

# -----------------------------
# Draw each heatmap
# -----------------------------
for i, (tf_name, tf_formula, tf_weight) in enumerate(tf_variants):
    for j, (idf_name, idf_formula, idf_weight) in enumerate(idf_variants):
        ax = axes[i, j]

        # Score matrix: vertical axis = df, horizontal axis = tf
        score = np.outer(idf_weight, tf_weight)

        finite_vals = score[np.isfinite(score)]
        vmax = float(np.max(finite_vals))
        vmin = float(np.min(finite_vals))

        im = ax.imshow(
            score,
            origin="lower",
            aspect="auto",
            extent=(-0.5, 100.5, 0.5, 100.5),
            interpolation="nearest",
            cmap="turbo",
            norm=Normalize(vmin=vmin, vmax=vmax),
        )

        # Column labels
        if i == 0:
            ax.set_title(f"{idf_name}\n{idf_formula}", fontsize=10, pad=6)

        # Row labels
        if j == 0:
            ax.set_ylabel(f"{tf_name}\n{tf_formula}\n\ndf", fontsize=10)

        # Bottom x label
        if i == rows - 1:
            ax.set_xlabel("tf", fontsize=10)

        # Max annotation
        ax.text(
            0.98, 0.02, f"max={vmax:.2f}",
            transform=ax.transAxes,
            ha="right", va="bottom",
            fontsize=7,
            color="white",
            bbox=dict(
                boxstyle="round,pad=0.16",
                facecolor=(0, 0, 0, 0.28),
                edgecolor="none",
            ),
        )

        # Ticks
        ax.set_xticks([0, 25, 50, 75, 100])
        ax.set_yticks([1, 25, 50, 75, 100])
        ax.tick_params(labelsize=8)

        # Colorbar = legend for each panel
        cbar = fig.colorbar(im, ax=ax, fraction=0.046, pad=0.02)
        cbar.ax.tick_params(labelsize=7)

# No overall title or extra explanation
fig.tight_layout()

# Save
fig.savefig("tfidf_grid_4x5_turbo_with_colorbars.png", dpi=200, bbox_inches="tight")

# Show
plt.show()
BM25 のコード
import numpy as np
import matplotlib.pyplot as plt
from pathlib import Path

# BM25 settings (same as previous figure)
N = 100_000
k1, b = 1.2, 0.75
avg_length = 100
dfs = [0, 1, 100, 10_000]
tf = np.linspace(0, 100, 501)
doc_length = np.arange(1, 1001)
X, Y = np.meshgrid(tf, doc_length)

def bm25_scores(df):
    idf = np.log1p((N - df + 0.5) / (df + 0.5))
    denominator = X + k1 * (1 - b + b * Y / avg_length)
    return idf * X * (k1 + 1) / denominator

scores = [bm25_scores(df) for df in dfs]
vmax = max(np.max(score) for score in scores)

fig, axes = plt.subplots(1, 4, figsize=(18, 5.2), dpi=160, sharex=True, sharey=True)
for ax, df, score in zip(axes, dfs, scores):
    image = ax.imshow(
        score, origin="lower", aspect="auto",
        extent=(0, 100, 1, 1000),
        cmap="turbo", vmin=0, vmax=vmax,
        interpolation="nearest"
    )
    ax.set_title(f"df = {df:,}", fontsize=14, pad=10)
    ax.set_xticks(np.arange(0, 101, 20))
    ax.set_xlabel("Term frequency (tf)", fontsize=10)
    ax.set_yticks([1, 200, 400, 600, 800, 1000])
    ax.tick_params(labelsize=9)

axes[0].set_ylabel("Document length (L)", fontsize=11)
fig.subplots_adjust(left=0.06, right=0.90, bottom=0.15, top=0.88, wspace=0.13)
cax = fig.add_axes([0.915, 0.15, 0.017, 0.73])
cbar = fig.colorbar(image, cax=cax)
cbar.set_label("BM25 score (single term)", fontsize=11)

output = Path("bm25_heatmaps_doclength_tf_by_df_turbo.png")
fig.savefig(output, dpi=200, bbox_inches="tight")
plt.show()
print(output)